Market Minute
December 2022 – By Scott Rosenquist, CFA®
As the year is coming to an end, investors will be sharpening their pencils as they look toward 2023 and the outlook for corporate earnings. Over the long run, earnings growth is a key driver of returns along with the outlook for the economy and investor sentiment.
The valuation starting point is also a good indicator for long-run returns. As the chart from J.P. Morgan below shows, the forward price-to-earnings multiple has contracted from elevated levels earlier in the year as inflation and higher interest rates slow the economy. The broad market is down just over 15% this year while earnings growth for the year through the third quarter is positive. The energy sector has greatly influenced positive earnings this year.
This year has been a story of multiple compression as short-term interest rates have risen dramatically as the Federal Reserve continues to combat inflation. This puts pressure on how much investors are willing to pay for future earnings and reduces the multiple. Earnings growth also factors into this as higher growth increases the denominator of the price to earnings. This will be closely watched as the calendar turns over. As of now, consensus estimates show roughly 5% growth for next year, but estimates have been coming down.
S&P 500 Index: Forward P/E ratio
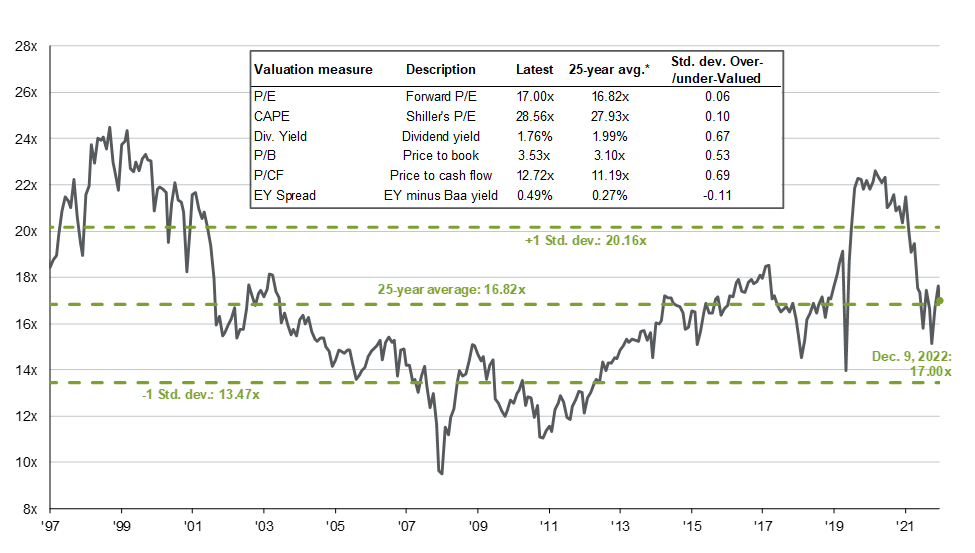
Source: FactSet, FRB, Refinitiv Datastream, Robert Shiller, Standard & Poor’s, Thomson Reuters, J.P. Morgan Asset Management. Price-to-earnings is price divided by consensus analyst estimates of earnings per share for the next 12 months as provided by IBES since December 1997 and by FactSet since January 2022. Current next 12-months consensus earnings estimates are $232. Average P/E and standard deviations are calculated using 25 years of history. Shiller’s P/E uses trailing 10-years of inflation-adjusted earnings as reported by companies. The dividend yield is calculated as the next 12-months consensus dividend divided by most recent price. Price-to-book ratio is the price divided by book value per share. Price-to-cash flow is price divided by NTM cash flow. EY minus Baa yield is the forward earnings yield (consensus analyst estimates of EPS over the next 12 months divided by price) minus the Moody’s Baa seasoned corporate bond yield. Std. dev. over-/under-valued is calculated using the average and standard deviation over 25 years for each measure. *P/CF is a 20-year average due to cash flow availability. Guide to the Markets – U.S. Data are as of December 9, 2022.
Now that interest rates have increased, fixed income may be attractive. This could keep a lid on any multiple expansions next year and any economic uncertainty from the Federal Reserve’s efforts to lower inflation. This may put earnings growth in the spotlight even more as the driver of returns. A balanced approach for the coming year seems appropriate with other asset classes now more attractive.
The opinions voiced in this material are for general information only and are not intended to provide specific advice or recommendation for any individual. Although general strategies and/or opinions are revealed, this post is not intended to, nor does it represent or reflect, transactions or activity specific to any one account. To determine which investment(s) may be appropriate for you, consult your financial advisor prior to investing. All performance referenced is historical and is no guarantee of future results. All data and information is gathered from sources believed to be reliable and is not warranted to be correct, complete, or accurate. Investments carry the risk of loss including loss of principal. Past performance is never a guarantee of future results.