July 26, 2021 – Daniel Zalipski, CFA®
With markets bouncing around all-time highs, while concerns of delta variants and inflation continue to dominate the headlines, it is no surprise that some are beginning to expect a market correction in the near-term. A market correction is defined by a 10% drop from the most recent peak. They can happen quickly or be drawn out over several weeks.
Sometimes they are barely noticed, such was the case when the Nasdaq declined just over 10% from February 12th to March 8th of this year. At other times, it seems to be the only thing investors are focused on, such was the case in the fourth quarter of 2018 with the S&P 500 sliding over 15% during those 3 months. Regardless if they are quick or prolonged, obvious or not, market corrections can rattle an investor’s convictions and jeopardize their long-term goals. It may be surprising, but market corrections are not that uncommon, and occur on average once a year. Attempting to maneuver to avoid a correction is often a fool’s errand that can result in poor performance. Our friends at JP Morgan have compiled some data on this topic presented in some graphs below.
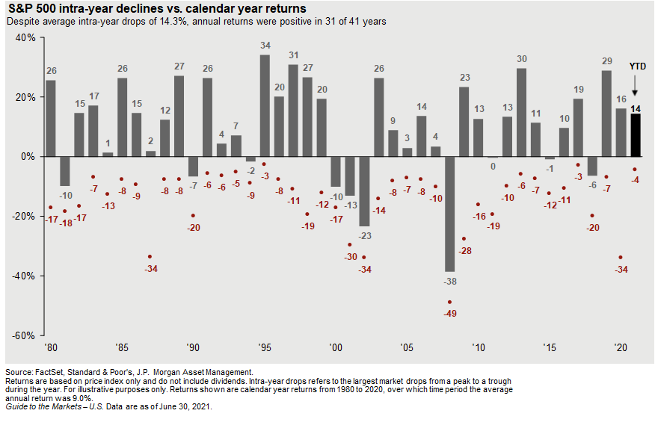
Corrections and drawdowns, as tough as they can be, are somewhat routine. Below is a JP Morgan graph that depicts the frequency of drawdowns within the S&P 500 from a year-to-year basis. The gray bars represent the calendar-year returns, while the red dots represent intra-year declines. The graph also demonstrates that despite the frequent intra-year declines, the S&P 500 index still ends the year with positive performance a majority of the time. Looking back to 1980, the S&P 500 achieved positive returns for 31 of the last 41 years. Disciplined investors recognize the routine nature of corrections and the benefit to staying in the market during volatile stretches.
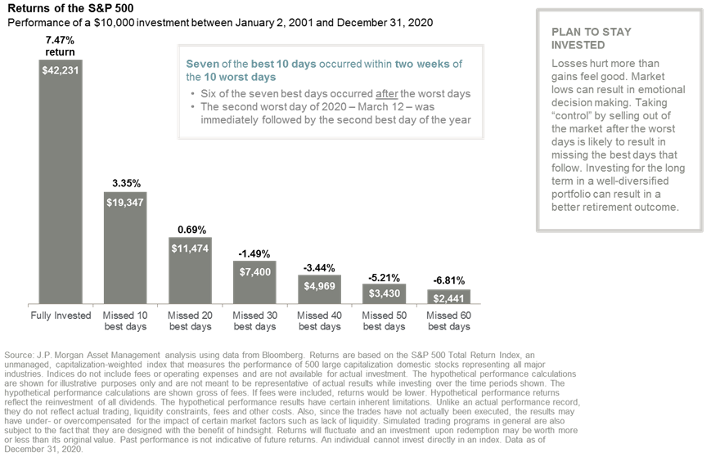
The urge to time the market is hard to resist, and rarely works in the investor’s favor. Peaks and troughs, in hindsight, may seem obvious and encourage investors to attempt to time their trades to avoid the next big drop. The problem with volatility is it can cut both ways. Some of the best single-day returns within the market occur within two weeks of the worst single-day returns. Attempting to avoid the worst days may lead to missing some of the best, with devastating results on performance. The graph below from JP Morgan demonstrates the results on performance of missing the best single-day returns over a 20-year period. A fully invested account, meaning they feel both the worst and best days, has the highest return of the group. Missing the best 10 single-day market returns cuts it by more than half. As the graph highlights, the best days almost always occur after the worst. Therefore, an investor who sells during some of the worst days is more likely to miss the best days.
Market corrections should not be feared as a devastating event, but rather understood as a somewhat regular event of normal functioning markets. It is also important to understand the potential impact investors can have on their returns should they attempt to side-step these events. Maintaining a long-term focus with a well-diversified portfolio is a more prudent way to approach investing and offers a greater probability of success compared to negatively reacting to corrections and attempting to time the market. To quote famous investor Peter Lynch, “Far more money has been lost by investors preparing for corrections, or trying to anticipate corrections, than has been lost in corrections themselves.”
The opinions voiced in this material are for general information only and are not intended to provide specific advice or recommendation for any individual. Although general strategies and / or opinions are revealed, this post is not intended to, nor does it represent or reflect, transactions or activity specific to any one account. To determine which investment(s) may be appropriate for you, consult your financial advisor prior to investing. All performance referenced is historical and is no guarantee of future results. All data and information is gathered from sources believed to be reliable and is not warranted to be correct, complete or accurate. Investments carry risk of loss including loss of principal. Past performance is never a guarantee of future results.